Scientists Say: X-axis
X marks the spot, and tells you what a graph shows
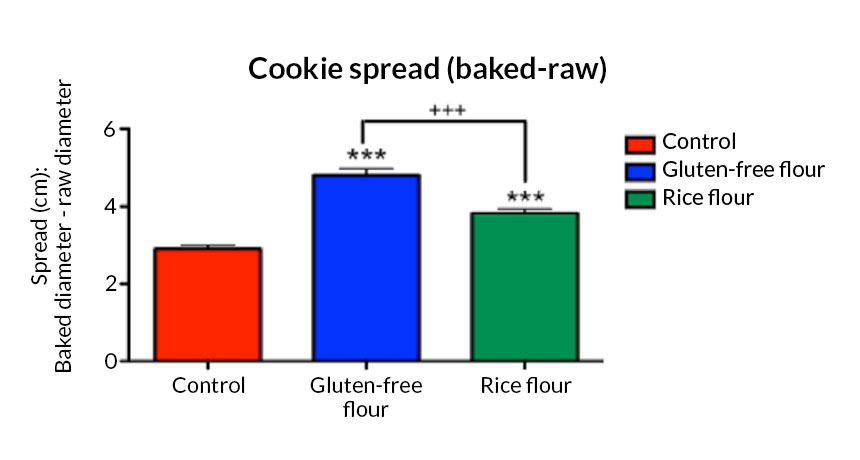
This graph shows how much cookies spread when baking. The x-axis identifies what’s in each cookie type.
B. Brookshire/SSP
x-axis (noun, “Ex AXE-iss”)
A horizontal line on a graph. It is usually located at the bottom of the graph but can also be at the top or in the middle. Scientists label the x-axis with whatever they are measuring. This might be a list of different items measured. Or it can be a series of numbers that help to show how a variable changes over time.
In a sentence
When I graphed how “chewy” people thought cookies were, I put the ingredients in each cookie on the x-axis.
Follow Eureka! Lab on Twitter
Power Words
(for more about Power Words, click here)
axis The line about which something rotates. On a wheel, the axis would go straight through the center and stick out on either side. (in mathematics) An axis is a line to the side or bottom of a graph; it is labeled to explain the graph’s meaning and the units of measurement.
x-axis (in mathematics) The horizontal line at the bottom of a graph, which can be labeled to give information about what the graph represents.
y-axis (in mathematics) The vertical line to the left or right of a graph, which can be labeled to give information about what the graph represents.