Cookie Science 8: The meaning of the mean
With data in hand, I can compare my cookies — using math

All of these papers and all of these cookies produced a lot of cookie rankings. I need to convert those to numbers, and use math to figure out if people think some cookies taste better than others.
B. Brookshire/SSP
This article is one of a series of Experiments meant to teach students about how science is done, from generating a hypothesis to designing an experiment to analyzing the results with statistics. You can repeat the steps here and compare your results — or use this as inspiration to design your own experiment.
I am trying to bake a gluten-free cookie that tastes as good as my regular cookies. I baked three different recipes. I then let 41 people sample them and rate them. Now I need to take all of these numbers from my ranking statements and conclude what people think of my cookies. Here (and in the next two posts), I’ll go through how to turn survey responses into numbers I can use to compare the differences between my cookies. It took a lot of math, but I’ll show you what I did — and how you could do this too to make sense of your research findings.
I asked my cookie tasters to rate my baked goods on a number of different qualities. To keep things simple here, I’ll work with just one statement. I used the same process for each of the other rankings.
In my experiment, subjects ate three cookies. One was a control, or the normal chocolate chip recipe. A second was made from chocolate-chip batter containing a mix of gluten-free flours. For the last batter, I used a gluten-free rice flour.
After sampling each cookie, my taste testers responded to a series of statements on a Likert scale. Likert scales are statements, such as “I like X.” For each statement, participants choose how closely they agree or disagree with the statement. The tasters then circle their responses.
The last statement on every survey was: “Overall, I like this cookie.” I will use that statement as an example of how I worked with all of my data. Each taster responded by circling one of the following:
- Strongly Disagree
- Disagree
- Undecided
- Agree
- Strongly Agree
Each response corresponds to a number, one through five. So, for example, after eating the control cookie, a participant may circle “agree” in response to “I like this cookie.” I would count that answer as a 4. If they circle the “disagree” response after eating one of the gluten-free cookies, I would count that answer as a 2.
One at a time, for each cookie, I add up everyone’s response. To assess how most people ranked that cookie, I will want to find the average ranking — or arithmetic mean.
To do this, I take that tally of all of the numerical responses for one cookie. I then divide the sum by the number of people who responded. For example, say three people ate my control cookie. One ranked it 3, another gave it a 4 and the last gave it a 5. The sum of those three numbers is 12. I then divide it by three (the number of people who responded) and end up with 4. That’s the “mean” score for this cookie.
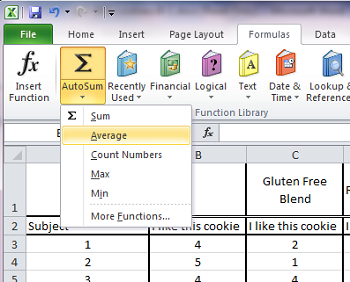
In Microsoft Excel, the spreadsheet program will calculate this for you. All you have to do is go to the box below your data, and select the formula for “average” (that’s the word the program uses to calculate the arithmetic mean). This can be found under “formulas.” Then you highlight the data set you want to apply this calculation to — and voila, the program supplies the mean.
The real responses for “I like this cookie” are pictured below. People rated the control cookies a 3.83. But the average for each type of gluten-free cookie is lower, just 2.85.
| Control | Gluten Free Blend | Rice Flour | |
| Subject | I like this cookie | I like this cookie | I like this cookie |
| 1 | 4 | 2 | 2 |
| 2 | 5 | 1 | 1 |
| 3 | 4 | 4 | 3 |
| 4 | 1 | 4 | 4 |
| 5 | 4 | 4 | 4 |
| 6 | 5 | 2 | 1 |
| 7 | 4 | 1 | 1 |
| 8 | 4 | 1 | 4 |
| 9 | 2 | 3 | 3 |
| 10 | 4 | 2 | 4 |
| 11 | 4 | 3 | 2 |
| 12 | 4 | 4 | 2 |
| 13 | 4 | 5 | 3 |
| 14 | 5 | 2 | 3 |
| 15 | 4 | 2 | 4 |
| 16 | 3 | 4 | 5 |
| 17 | 5 | 5 | 5 |
| 18 | 4 | 4 | 4 |
| 19 | 4 | 1 | 4 |
| 20 | 5 | 5 | 5 |
| 21 | 4 | 5 | 5 |
| 22 | 4 | 3 | 2 |
| 23 | 4 | 5 | 2 |
| 24 | 4 | 3 | 3 |
| 25 | 4 | 2 | 1 |
| 26 | 4 | 2 | 2 |
| 27 | 2 | 2 | 2 |
| 28 | 4 | 2 | 2 |
| 29 | 4 | 2 | 3 |
| 30 | 3 | 2 | 3 |
| 31 | 4 | 2 | 1 |
| 32 | 5 | 4 | 3 |
| 33 | 4 | 3 | 2 |
| 34 | 1 | 1 | 1 |
| 35 | 4 | 4 | 4 |
| 36 | 3 | 2 | 2 |
| 37 | 4 | 4 | 4 |
| 38 | 4 | 2 | 2 |
| 39 | 5 | 2 | 2 |
| 40 | 4 | 3 | 4 |
| 41 | 3 | 3 | 3 |
| Mean (Sum of rankings divided by number of tasters) | 3.83 | 2.85 | 2.85 |
The control certainly looks like it scored better than the two gluten-free cookies. But I can’t just look at these means and declare that the cookies tasted different. For that, I need to find out if the range of responses differs between the control cookies and the gluten-free alternatives. So next, I have to run a statistical analysis, a process that lets me compare different sets of data. In the next blog, you’ll see how I did this, by finding what’s known as the standard deviation.
Follow Eureka! Lab on Twitter
Power Words
average (in science) A term for the arithmetic mean, which is the sum of a group of numbers that is then divided by the size of the group.
control A part of an experiment where nothing changes. The control is essential to scientific experiments. It shows that any new effect must be due to only the part of the test that a researcher has altered. For example, if scientists were testing different types of fertilizer in a garden, they would want one section of to remain unfertilized, as the control. Its area would show how plants in this garden grow under normal conditions. And that give scientists something against which they can compare their experimental data.
gluten A pair of proteins — gliadin and glutenin — joined together and found in wheat, rye, spelt and barley. The bound proteins give bread, cake and cookie doughs their elasticity and chewiness. Some people may not be able to comfortably tolerate gluten, however, because of a gluten allergy or celiac disease.
hypothesis A proposed explanation for a phenomenon. In science, a hypothesis is an idea that hasn’t yet been rigorously tested. Once a hypothesis has been extensively tested and is generally accepted to be the accurate explanation for an observation, it becomes a scientific theory.
Likert scale One of the most commonly used ways for ranking opinions or statements in surveys involving people. A issues a series of statements, such as “I like X,” “the test was easy,” or “it was too loud.” Participants then rate how well they agree by choosing from a range options that might range from “strongly agree” to “strongly disagree.”
mean One of several measures of the “average size” of a data set. Most commonly used is the arithmetic mean, obtained by adding the data and dividing by the number of data points.
statistics The practice or science of collecting and analyzing numerical data in large quantities and interpreting their meaning. Much of this work involves reducing errors that might be attributable to random variation. A professional who works in this field is called a statistician.
statistical analysis Mathematical processes that allow a scientists to make conclusions from a set of data.
statistical significance In research, a result is significant (from a statistical point of view) if the likelihood that an observed difference between two or more conditions would not be due to chance. Obtaining a result that is statistically significant means there is a very high likelihood that any difference that is measured was not the result of random accidents.
variable (in mathematics) A letter used in a mathematical expression that may take on more than one different value. (in experiments) A factor that can be changed, especially one allowed to change in a scientific experiment. For instance, when measuring how much insecticide it might take to kill a fly, researchers might change the dose or the age at which the insect is exposed. Both the dose and age would be variables in this experiment.