Analyze This: Beauty products are big sources of urban air pollution
Home cleaning and other products also turn out to be surprisingly large culprits
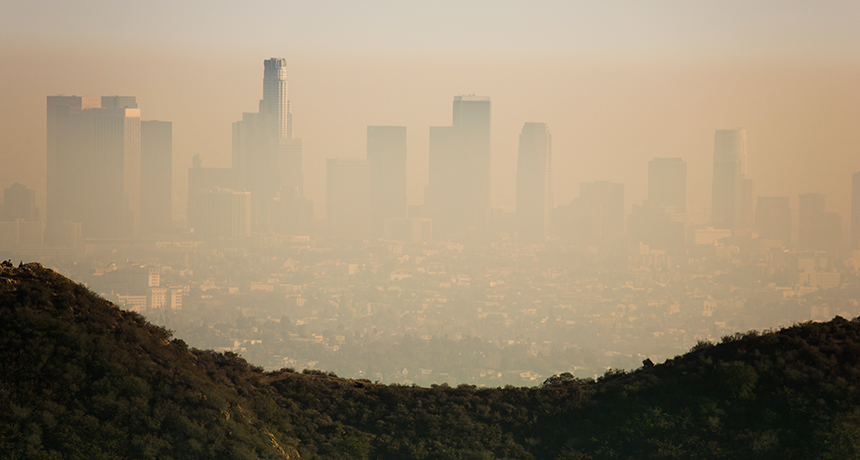
A large percentage of air pollution in cities such as Los Angeles, Calif., may be due to the use of common household products, one study finds. Each use of hairspray, glue and paint, for instance, has a small effect. But when used by millions of people, the effect on air quality can be large.
MattGush/iStockphoto
People commonly use shampoo, hairspray, deodorant, cleaning sprays, paint and glues. Such products can dirty the air. In fact, they are as bad for urban air as is burning gasoline or diesel fuel. That’s the finding of a recent study.
Each use of these products releases a mix of chemicals. Some of these belong to a class known as VOCs. That’s short for volatile organic compounds (which means they are gases and contain carbon). Many VOCs hang around in the outdoor air. Quite a few common VOCs come from products made from petroleum and other fossil fuels.
Certain VOCs can react with other chemicals in the air to create ozone. These VOCs can also help create particles known as “fine” (or small) particulates. Ozone is an ingredient of smog. That smog, along with high levels of fine particulates, can make it hard to breathe. This can be especially true for people who have lung problems, such as asthma. Ozone and particulates also can contribute to other lung problems, diabetes and heart disease.
When people think of outdoor air pollution, their thoughts probably go to the exhaust gases spewed by cars and trucks. Or they might think of gases leaving factory smokestacks. But “sources of air pollution [in cities] are becoming more diverse,” Brian McDonald told Science News. McDonald is a chemist. He works at the Cooperative Institute for Research in Environmental Sciences in Boulder, Colo. He shared his team’s new findings in February at a meeting of the American Association for the Advancement of Science in Austin, Texas.
On average, people use 15 times more gasoline and diesel, by weight, than VOC-emitting household products. But cosmetics, cleansers and other household products created 38 percent of the VOC emissions that this recent study found in city air.
In fact, those products were bigger contributors than fossil fuels were to the creation of fine particulates, ozone and smog. Frequent use of these products by millions of people daily can really add up to a lot of air pollution.

Data Dive:
- Examine the data for gasoline presented in both pie charts:
- What is the percent (by mass) of gasoline used?
- What percent (by mass) of the VOCs measured in Los Angeles are from gasoline fuel and exhaust?
- If the total mass of measured VOC emissions is about 350 gigagrams (385,809 tons), what is the mass of VOC emissions from gasoline and from exhausts emitted by its use?
- Calculate the approximate percent (by mass) of gasoline VOCs, due to gasoline use and the VOCs released by gasoline and its exhaust in the Los Angeles study. Show your work.
- What is the percent (by mass) of gasoline used?
- Examine the data for consumer and industrial products presented in both pie charts:
- What is the percent (by mass) of consumer and industrial products used?
- What percent of the VOC emissions measured in Los Angeles are from consumer and industrial products?
- What is the percent (by mass) of consumer and industrial products used?
- Based on the information in the pie charts, is the percent (by mass) of some class of product a good indicator of how much its use contributes to VOCs in city air? Explain your conclusion.
- What is a possible reason for why contributions for VOC emissions are higher for consumer products than they are for exhaust from gasoline or diesel fuel burning?
- Describe how you would represent the data in these pie charts as a bar graph, either with words or by drawing out the graph. Which representation is best suited for these data? Justify your answer.
Beyond the data:
What can you do to reduce pollution from VOC-releasing household products? Are there alternatives that can be used in your home?
Analyze This! explores science through data, graphs, visualizations and more. Have a comment or a suggestion for a future post? Send an email to sns@sciencenews.org.


