Cookie Science 7: How many to bake?
Collecting good data means taking a large sample. How do I calculate how many tasters I need?
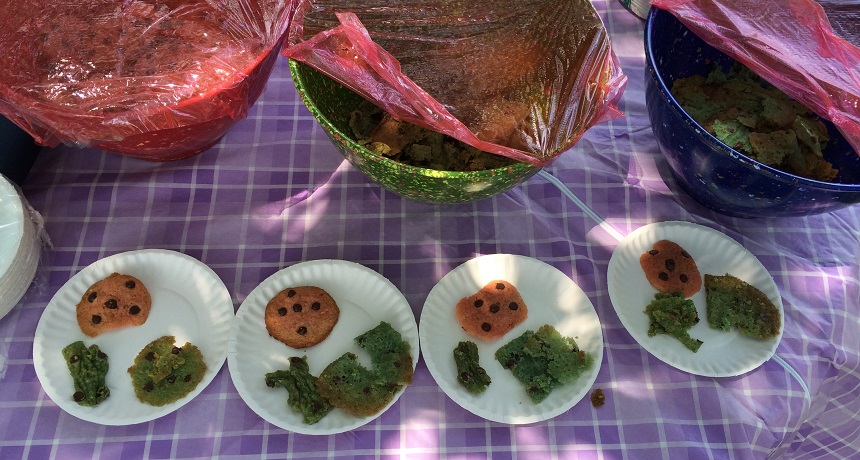
The cookies are baked and cookie science is ready for taste-testers.
B. Brookshire/SSP
This article is one of a series of Experiments meant to teach students about how science is done, from generating a hypothesis to designing an experiment to analyzing the results with statistics. You can repeat the steps here and compare your results — or use this as inspiration to design your own experiment.
I’m now baking up my first experiment to develop a tasty chocolate-chip cookie for my friend. She’s a woman who can’t stomach the gluten in wheat flour. Before I can bake up and give out all my cookies, I need to know how many cookies to make and how many tasters to recruit.
My hypothesis states that simply replacing normal wheat flour with gluten-free flour will not create a cookie that tastes as good as the original. To confirm — or refute — this, I need people to taste them. And I’ll need enough tasters to rule out that their assessments are due only to their individual preferences. Figuring out how many recruits I need is truly a numbers game. And here’s how I got my answer.
I could just ask one or two people to sample my cookies. But people can have very different taste preferences. So to gauge what most people prefer, I’ll need to have many recruits. Yet I can’t afford to bake thousands of cookies. So I need to find a scientific way — a mathematical way — to figure the fewest people I can recruit and still get a good cross-section of most taste preferences. If I get a sufficiently random sample of volunteers, I can use data from those volunteers to represent cookie eaters at large.
My goal is to learn whether people think my gluten-free cookies are better, worse or the same as my regular cookies. For each cookie, I am having people give a ranking that will tell me something about how they rate the cookies’ taste.
Then I will compare the overall rankings of one type against the ratings for another. I will be looking for a difference that is large enough to suggest that the gluten-free flours are responsible for the rankings, and that my results are not due to random variation in cookie preference.
To assess the differences between my cookies, I need to do some math. It’s called statistical analysis. This is the process that allows me to compare sets of data and determine whether any difference between them is substantial enough to say that the gluten-free flour is responsible. I will need to perform this analysis for each of the questions on the survey.
That analysis will look for a significant difference in how people rate the cookies. When scientists claim that something is significant, they don’t mean that it is important. Instead, when scientists say that some finding is statistically significant, they mean the result is probably not due to chance.
If I only had two or three people rate the cookies, any difference — or agreement — in their assessments may not be typical of people everywhere. Indeed, the more randomly selected people I get to rank my cookies, the more likely I will get a valid gauge of what most people think.
Statistics should help me figure out the fewest cookie samplers I’ll need. But which statistical tests? When in doubt, ask people who work in this field. I did.
Beware two types of “errors”
I spoke with several scientists who have taught statistics. Terry McGlynn is a biologist at California State University in Dominguez Hills. I also talked to my dad, Robert Brookshire, who teaches information technology at the University of South Carolina in Columbia.
Both advised that to figure out how many taste testers I’ll need, I must think about the two main types of error people make in interpreting the results of an experiment. Called Type I and Type II errors, they depend on what is called a null hypothesis.
A research hypothesis is a statement of a difference that I think will show up between the things I am measuring. For my tests, I hypothesize that cookies made from gluten-free flour will taste different than wheat flour cookies. But I could be wrong. The flour might make no difference at all. Assuming there might be no difference is what’s called the null hypothesis. The errors scientists have to worry about are based on that null hypothesis.
Now for those possible errors. A false positive error would be concluding that my cookies taste different because of the flour when in fact the flour had no effect. A false negative error would conclude the opposite: that the flour had no effect on the cookies’ taste, when actually it did. Having enough people sample my cookies should help me avoid each type of error.
On to the numbers
In general, scientists argue that it is worse to claim your experiment worked, and be wrong (a false positive), than to claim it didn’t work and be wrong (a false negative). So I want the likelihood of a false positive to be very small. Over time, scientists in fields such as biology have settled on a 5 percent chance that they turn up a false positive as an acceptable value. Numerically, that number is expressed as 0.05, and is known as “alpha.”
Because false negatives generally are not quite as bad, an acceptable level for this risk would be around 20 percent (or 0.2). With a 20 percent chance of making a false negative error, I have an 80 percent chance (or 0.8) of finding any true difference between my cookies. That 0.8 figure is my power, the probability of finding a true difference if it exists.
With these numbers in hand, I can now go to a chart and look up how many people I will need to have an 80 percent chance of uncovering a true difference in my cookies. I found such a chart in a 1992 paper by Jacob Cohen of New York University. (A free copy of the paper, published in Psychological Bulletin, is available here. I consulted its table 2.)
My experiment will test three groups. My control cookies are made with wheat-based flour and contain gluten. I will test them against two experimental cookies: cookies made from a gluten-free flour mix and cookies made from rice flour. So I will have to perform a specific numerical test to detect differences between more than two groups. It’s called an analysis of variance — or ANOVA. Looking at the table in Cohen’s paper, there is a column for a power of 0.8, an alpha of 0.05 and three test groups.
The table shows me that I should be able to detect a large difference in the taste of my three recipes if 21 people eat my cookies. To detect a very small difference between the cookie groups, I’d need 322 taste testers. If there is only a medium difference in the cookies’ taste, I could get by with 52 people.
Getting people to eat cookies is harder than it looks
I was pretty sure that there would be a difference between what people thought of my control and gluten-free cookies. So I set my goal at 52 people. I advertised at Science News (where I work) and Society for Science & the Public (our parent organization), asking for people willing to sample my cookies. I also advertised in the town of Cheverly, Md., using its email listserv. In the end, only 41 people came out to eat cookies for science. This means my power is lower than the 0.8 that I had wanted. This suggests that unless the difference in taste is dramatic, I may have a less than 80 percent chance of uncovering a real difference between the normal wheat flour and gluten-free flours (if there truly is a difference).
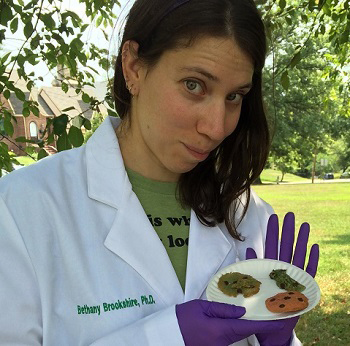
Each person had to read and sign a consent form. Once they did that, I gave them a plate with three cookies. They were color-coded so that my taste testers could rate them on their survey without knowing what was different about each cookie. This made them blind to the experimental conditions — meaning they would not be able to tell by sight which cookie came from which recipe.
Each participant then answered questions using a Likert scale. The Likert scale uses statements like “this cookie is chewy.” The volunteers then mark how much they agree or disagree with the statement.
Two days and many, many cookies later, I had their surveys and all of my data. Now it’s time to crunch the numbers and figure out my results.
Follow Eureka! Lab on Twitter
Power Words
ANOVA The acronym for analysis of variance, a statistical test to probe for differences between more than two test conditions.
bias The tendency to hold a particular perspective. Scientists often blind subjects to the details of a test so that the participant’s biases will not affect the results.
blinding (in research) The deliberate hiding of some important test information from a participant. For instance, a researcher might put a blindfold on participants before they eat something. This prevents them from being influenced by a food’s appearance. For a test of how well a drug works, researchers may give each person a capsule or shot. But only one group gets the real drug. Others might get an inactive “sugar pill” or injection of salt water. By not knowing if they got the real deal or an imposter, participants’ responses should not be biased for or against a particular result.
celiac disease (or coeliac disease in the United Kingdom) A disorder in which the immune system attacks the small intestine after it encounters foods containing gluten, a wheat protein compound. People with this disease suffer from stomach pain, constipation, diarrhea and a constant feeling of fatigue. They must avoid gluten-containing products like bread, cake and cookies.
control A part of an experiment where nothing changes. The control is essential to scientific experiments. It shows that any new effect must be due to only the part of the test that a researcher has altered. For example, if scientists were testing different types of fertilizer in a garden, they would want one section of to remain unfertilized, as the control. Its area would show how plants in this garden grow under normal conditions. And that give scientists something against which they can compare their experimental data.
false negative In statistics, a conclusion — based on the data — that a difference that is the result of what you are testing does not exist, when in fact there is an effect of your experiment.
false positive In statistics, a conclusion — based on the data — that a difference that is the result of what you are testing exists between two or more conditions, when in fact there is no effect of the variable you are testing.
gluten A pair of proteins — gliadin and glutenin — joined together and found in wheat, rye, spelt and barley. The bound proteins give bread, cake and cookie doughs their elasticity and chewiness. Some people may not be able to comfortably tolerate gluten, however, because of a gluten allergy or celiac disease.
hypothesis A proposed explanation for a phenomenon. In science, a hypothesis is an idea that hasn’t yet been rigorously tested.
Likert scale One of the most commonly used ways for ranking opinions or statements in surveys involving people. Each Likert survey contains a series of statements, such as “I like X,” “the test was easy,” or “it was too loud.” Participants then rate how well they agree by choosing from a range options that might range from “strongly agree” to “strongly disagree.”
null hypothesis In research and statistics, this is a statement acknowledging that there might be no difference or relationship between two or more things being tested. Conducting an experiment is often an effort to reject the null hypothesis, or to prove that there is a difference between two or more conditions.
protocol (in science) A written procedure to describe how an experiment will be conducted. Protocols are written before an experiment is performed and are used to make sure that the experiment meets standards for fairness and good practice. Protocols also allow other people to attempt the same experiment and see if they can replicate previous results.
statistics The practice or science of collecting and analyzing numerical data in large quantities and interpreting their meaning. Much of this work involves reducing errors that might be attributable to random variation. A professional who works in this field is called a statistician.
statistical analysis A mathematical process that allows scientists to draw conclusions from a set of data.
statistical significance In research, a result is significant (from a statistical point of view) if the likelihood that an observed difference between two or more conditions would not be due to chance. Obtaining a result that is statistically significant means there is a very high likelihood that any difference that is measured was not the result of random accidents.
variable (in mathematics) A letter used in a mathematical expression that may take on more than one different value. (in experiments) A factor that can be changed, especially one allowed to change in a scientific experiment. For instance, when measuring how much insecticide it might take to kill a fly, researchers might change the dose or the age at which the insect is exposed. Both the dose and age would be variables in this experiment.