Cool Jobs: Wet and wild weather
Forecasters depend on data gathered by scientists on the ground, in the air and up in space
Kuzma/istockphoto
Weather forecasting can’t prevent severe weather. It can, however, spot when storms are on the way. The more accurate those forecasts can be, the better. Then people can plan to avoid the worst consequences.
For instance, when weather forecasters predicted several feet of snow in late January, my daughter Laura worried. She did not want to be alone with a sick baby in her home outside Washington, D.C. She didn’t want to pass her son’s cold on to friends’ children, either. Instead, Laura packed a couple of bags. She buckled baby Martin in his car seat. Then she started driving the night before the snow began.
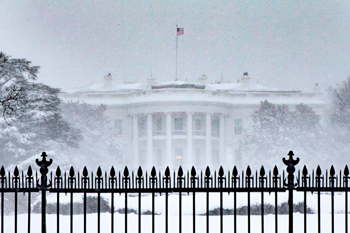
The storm earned the nickname “Snowzilla.” Up to a meter (3 feet) or more of snow fell along the U.S. East Coast over the next two days. A quarter million people lost electricity. At least 48 people died. But thanks to weather forecasters, many schools, businesses and government offices shut down before the worst hit. New York City even shut down Broadway performances that weekend. And Laura and Martin spent a safe, storm-free weekend in northern Ohio.
Accurate weather forecasting requires good science. In this story, meet two scientists and an engineer whose work deals with wet and wild weather. Their research can help save lives when the weather outside turns frightful.
Measurements on the ground
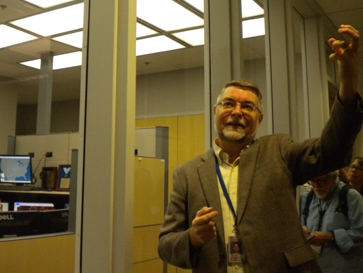
“Never in my wildest dreams did I think I would get this job,” says Greg Carbin. As a boy in Vermont, Carbin saw lots of snowstorms. And they got him interested in the science of weather. In college, he studied meteorology — the science of weather and the atmosphere. Now Carbin heads up forecast operations at the Weather Prediction Center of the National Weather Service in College Park, Md. It’s run by the National Oceanographic and Atmospheric Administration.
The National Weather Service issues warnings about tornadoes, floods and other severe events. Thunderstorms usually play a key role in all of these. But a thunderstorm needs three things to exist, Carbin says. “The atmosphere needs to have instability, moisture and something to lift it.”
Instability in the atmosphere happens when the temperature of the air near the ground differs a lot from that higher up. The greater the difference, the more instability.
Lift comes from convection. Warm air rises because it is less dense than cool air. When the warm air meets cold air higher up in the atmosphere, water vapor in the air can change from a gas to a liquid. In other words, it condenses. That produces rain or drizzle. If the temperature drops below freezing, the water can freeze into snow, hail or sleet.
Of course, not every rain shower is a thunderstorm. And not every thunderstorm causes trouble. Big problems arise when thunderstorms last long enough to build in size and strength. That takes wind shear. Wind shear happens when two currents of moving air hit each other at different angles or speeds. Wind shear lets a thunderstorm last longer. It’s also key to getting a storm to rotate. If it does, watch out! A rotating storm can grow into a hurricane or tornado.
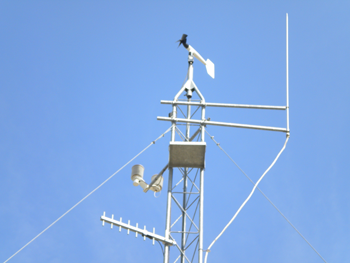
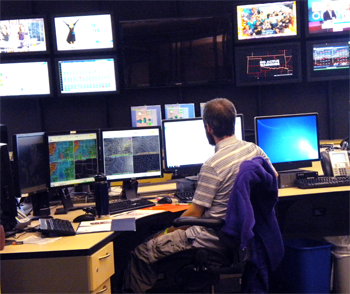
Measurements on the ground are crucial to forecasting storms. Throughout the day, stations across the country send measurements of temperature, precipitation and wind speed (and direction) to the National Weather Service. Its computers collect all of those data for Carbin and other forecasters. Those forecasters review maps that plot out the data. Then they connect the dots — both literally and figuratively. They draw lines to link places with similar measurements.
These maps show where areas of warm and cold air collide. That helps forecasters see where trouble spots — storms — might form.
Computers also can do some of that drawing. “But they don’t do it as well,” Carbin says. “I have to do this analysis by hand and see all the subtleties that are occurring.” Some meteorologists draw weather maps as often as once an hour.
Computers also play a big role. Fortunately, Carbon notes, “There’s a lot of powerful computing capability now.” Much of the physics behind the weather can be described with equations. That means that scientists can build computer models that simulate weather patterns. These computer models use mathematics to calculate how any change to one or more weather features might alter a forecast. Computers can solve those equations much faster than people can. What they come up with can help scientists make better judgments about where storms will form — and how they’ll behave.
Computers also collect and pull together all the measurements that go into the weather maps that meteorologists prepare. Those readings come from all around the world, and high above it as well.
Eyes in the sky
Probably the easiest way to measure precipitation on the ground is with a rain gauge. In its simplest form, it consists of a container to catch water and a measuring stick. Plop a rain gauge outside, and see how much water fills it up in some storm event. Sounds easy, right?
Despite their ease of use, relatively few rain gauges cover the Earth’s surface. “In fact, all the rain gauges in the world would only fit into two basketball courts,” says Dalia Kirschbaum at NASA in Greenbelt, Md. (NASA stands for the National Aeronautics and Space Administration.) She knows because she and her colleagues did the math. They presented their work to the European Geophysical Union at its spring 2014 meeting in Vienna, Austria.
Weather radar can cover much more land area than a single rain gauge. That radar sends pulses of microwaves to map storms. But it has limitations. For example, heavy rains that hit California depend on how a storm strengthens out in the Pacific Ocean. Notes Kirschbaum, “The ground-based radar can’t see that storm coming very far off the coast.”
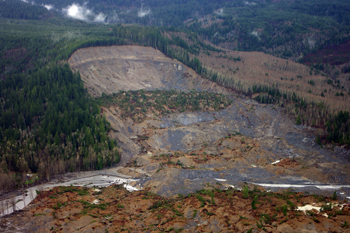
She was curious about rainfall. That’s because much of her work deals with what happens when heavy rains hit. Too much rain falling too quickly can lead to landslides. As a geomorphologist, Kirschbaum studies those events and other changes in Earth’s features. Her job also requires using rainfall data from a NASA satellite.
When Kirschbaum started college, she planned to study math. Then she took a class on environmental science — and was hooked. Now, much of her research on landslides involves work with computer models. She’s interested in problems where math and science meet the real world, as in natural disasters.
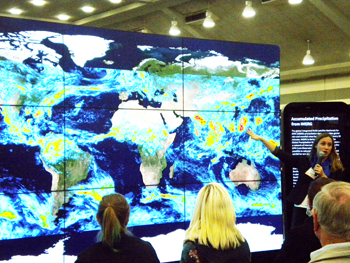
Scientists such as Kirschbaum use data from the Global Precipitation Measurement (GPM) mission and other satellite projects. GPM’s Core satellite is an eye in the sky for rain and other precipitation. Its orbit covers about 90 percent of Earth’s surface. It can “see” from the Arctic Circle in the north to the Antarctic Circle in the south.
Story continues below video.
NASA SVS
GPM sees through clouds to storms and precipitation below. The satellite’s sensors measure microwave radiation. Its energy has longer wavelengths than visible light. But like visible light, microwave radiation bounces off of the things that it hits. They include raindrops. “Based on what the sensors get back, you’re able to see layer by layer through the clouds and the storm,” Kirschbaum explains.
Better still, GPM can detect differences in the microwave radiation from the sun that bounces off various types of precipitation. “With GPM we can actually observe everything from light rain to heavy rain and snow,” she says. Data from this and other satellites now provide worldwide precipitation estimates every three hours.
Scientists at NOAA, the Naval Research Center and elsewhere use those data in their weather forecasts. For example, data that show where rain is most intense can help forecasters see how strong a storm is. Those data also offer clues to a storm’s path.
NASA also produces visualizations — pictures or charts based on the data. Those help scientists understand what’s happening with the weather. And they help forecasters share weather information with the public. Satellite data also help improve weather-forecasting models.
Even Kirschbaum’s research on landslides uses GPM data. “By being able to have near-real-time rainfall data,” she says, “I’m able to better understand the where and the when of where landslide activity is possible.”
In one recent study, her team reviewed data on landslide events around the world. Sure enough, the days most likely to see a landslide had been those with the heaviest rains. In one set of data, they showed, six in every 10 landslides occurred when the day’s rainfall at that spot had been in the top 5 percent of all days at that site going back 14 years.
But weather is not the only factor that affects a landslide’s potentially deadly impacts. Most of these events occurred in Asia, North America and Southeast Asia. But for those in North America, deaths were less likely, the team found. Their data suggest that a lack of money and equipment to respond to disasters may help explain why some landslides lead to more deaths.
Kirschbaum and her colleagues reported on this work, late last year, in Geomorphology.
Down to Earth
Careers dealing with stormy weather can also be very down to Earth. As a boy, Robert Mason and his friends built rock dams to create swimming holes. “I was always truly fascinated by the movement of water,” he recalls. Now he’s a civil engineer. He heads the Office of Surface Water for the U.S. Geological Survey (USGS) in Reston, Va.
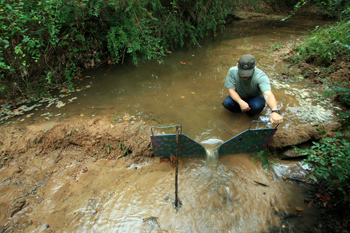
Mason’s office tracks water levels and river flows across the United States. USGS has stream gauges at many locations along rivers and streams. Those gauges record water levels and let USGS staff calculate stream flow. That’s the amount of water that passes a specific point in a certain amount of time. Stream flow matters because it tells whether the amount of water in a river is changing. It also tells researchers what’s likely to happen downstream.
“We at USGS go out and measure those flows periodically,” Mason notes. “We do it throughout the year — in normal flows, and in highs and lows. And particularly in flood events.”
Mason and his colleagues compare what happens during heavy storms to a river’s past measurements. “We can establish a relationship between a flow and a water level,” Mason says. That and other data go to the National Weather Service for its computer models. Those models then help the agency decide when to issue flood warnings. The data also help improve the models, Mason notes. Those models then help forecasters decide when a warning should be issued in the future.
Stream data also are key to understanding how changes such as shifts in land use might affect the environment. Adding more pavement, for instance, can increase the amount of runoff from storms (when water isn’t able to soak into the soil). Runoff can erode and widen streams. And fewer green plants along a stream’s banks can up the risk of floods.
“Increasingly, it’s important for us to have a more accurate picture” of what’s going on in a river, Mason says. That’s especially true when water levels approach critical heights, such as the top of a dam or the surface of a road. Analyses of the data also can help spot future risks.
USGS shares its data with the Army Corps of Engineers and other government agencies. Those data help them make decisions. For example, should people in charge of a reservoir hold water back? Or, should they release some of that water now in a controlled way — before a dam overflows?
“Reservoirs are a great asset for reducing floods and flood damage,” Mason says. “But to really wring the most value out of them, it’s important that we can time the response.”
When an area floods, USGS teams can put out mobile stream gauges and equipment to monitor what pollution might have washed into rivers. Researchers can then track how the water moves those pollutants. And that’s important. Pesticides, fertilizers and lead (and other metals) can run off of the land and into waterways. From there, those pollutants can harm people or the environment.
“We also look at other data that we can collect or infer from [the physical features of the land] and geology,” Mason says. “That helps inform us about what the past historic droughts and floods were like.” Those data often show “greater variability than what we typically expect and what we typically plan for,” Mason says. Understanding the full range of possible conditions matters a lot during a time of climate change. As climate patterns shift, governments need to plan for more extreme weather events.
These types of data also can identify risks that people might not otherwise consider. One recent report used historic data to estimate flood risks for nuclear power plants. Mason’s team provided the study to the Nuclear Regulatory Commission in 2014. Flooding was one factor that led to disaster at the Fukushima nuclear power plant. The flooding occurred after an earthquake and tsunami struck Japan in 2011.
Work by Carbin, Kirschbaum, Mason and their colleagues helps inform short-term forecasts and warnings of wild weather. It also improves the mathematics used to predict future events. And it plays into long-term planning for what to expect as Earth’s climate changes. All in all, says Mason, the work is “quite rewarding.”
“It is very interesting and it’s highly varied,” he explains. “We work with mathematical equations and computer systems. We also go out in the field and get wet and muddy and tired and hot.
“That,” he says, “makes for a very interesting career.”
This is one in a series on careers in science, technology, engineering and mathematics made possible with generous support from Arconic Foundation.


