Analyze This: How many insects are in the air?
Weather radar data help survey insect populations
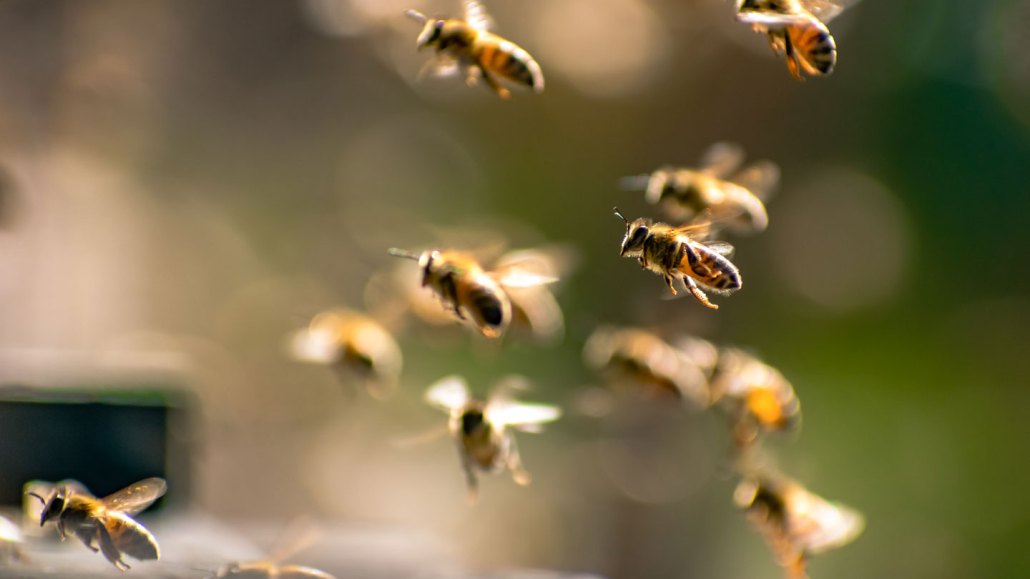
The air is a habitat, just like oceans, rivers and land. And important insect activities — such as mating and traveling from place to place — happen in the air. Radar can reveal the inhabitants of this often-forgotten realm.
S. Norero Image/Moment/Getty Images
This is a human-written story voiced by AI. Got feedback? Take our survey . (See our AI policy here .)
Mayflies mate in mid-air. Monarch butterflies make cross-continental flights. And dragonflies hunt as they soar. But despite how much insect activity happens in the air, scientists haven’t had a clear sense of insects’ abundance there. Now a team has found a way to estimate the density of insects in airspace using weather radar data. The approach could provide new clues about climate change’s impact on insects.
“Using radar to look at insects is a great moment to wonder about the rich animal life that is above our heads,” says Elske Tielens. An aero-ecologist, she studies interactions between organisms in the air. She works at the Swiss Federal Institute for Forest, Snow and Landscape Research in Zurich.
Scientists have long spied on tiny objects in the air using radar. Radar stations across the contiguous United States surveil the air for water drops, snow and hail. “But using it for insects, somehow, is something that we haven’t thought too much about,” Tielens says.
Radar sends out radio waves and analyzes the waves that bounce back. The technique can distinguish some types of particles based on certain properties, such as shape. Rain, for instance, is usually spherical. Insects tend to be rounded but longer in one dimension. These differences let meteorologists filter animals out of the data, Tielens says. Her team flipped that approach to remove rain.
The team used 10 years of weather radar data from almost 140 sites across the United States. That gave the researchers daily estimates of insect density in the air. “It’s the biggest time series data set that we have for insects in the U.S.,” Tielens says. The team found that U.S. skies host around 100 trillion flying insects on a typical summer day.
This new approach could also provide hints about overall insect abundance, Tielens says. Researchers have noticed dwindling numbers of insects at certain locations. That’s led some to worry about an insect apocalypse — the idea that insects everywhere could be faltering. But there hasn’t been enough data over a long time or large area to test the idea.
The team didn’t observe an overall decline in insect density over the United States from 2012 to 2021. At some sites insect density increased, while at others it decreased. The scientists shared their results in November 2025 in Global Change Biology.
Places with warming winters tended to see decreases in insect density. So did areas that had more buildings and roads. Other scientists could use the new study’s information to investigate local trends. Tielens plans to work with European countries to collect data on insect trends there.
This work shows how data gathered for one purpose can help answer other questions, Tielens says. “It turns out you can use [radar] in many more ways than that you expected.” Other data sets, too, might hold opportunities for creative reuse.
Frequent fliers
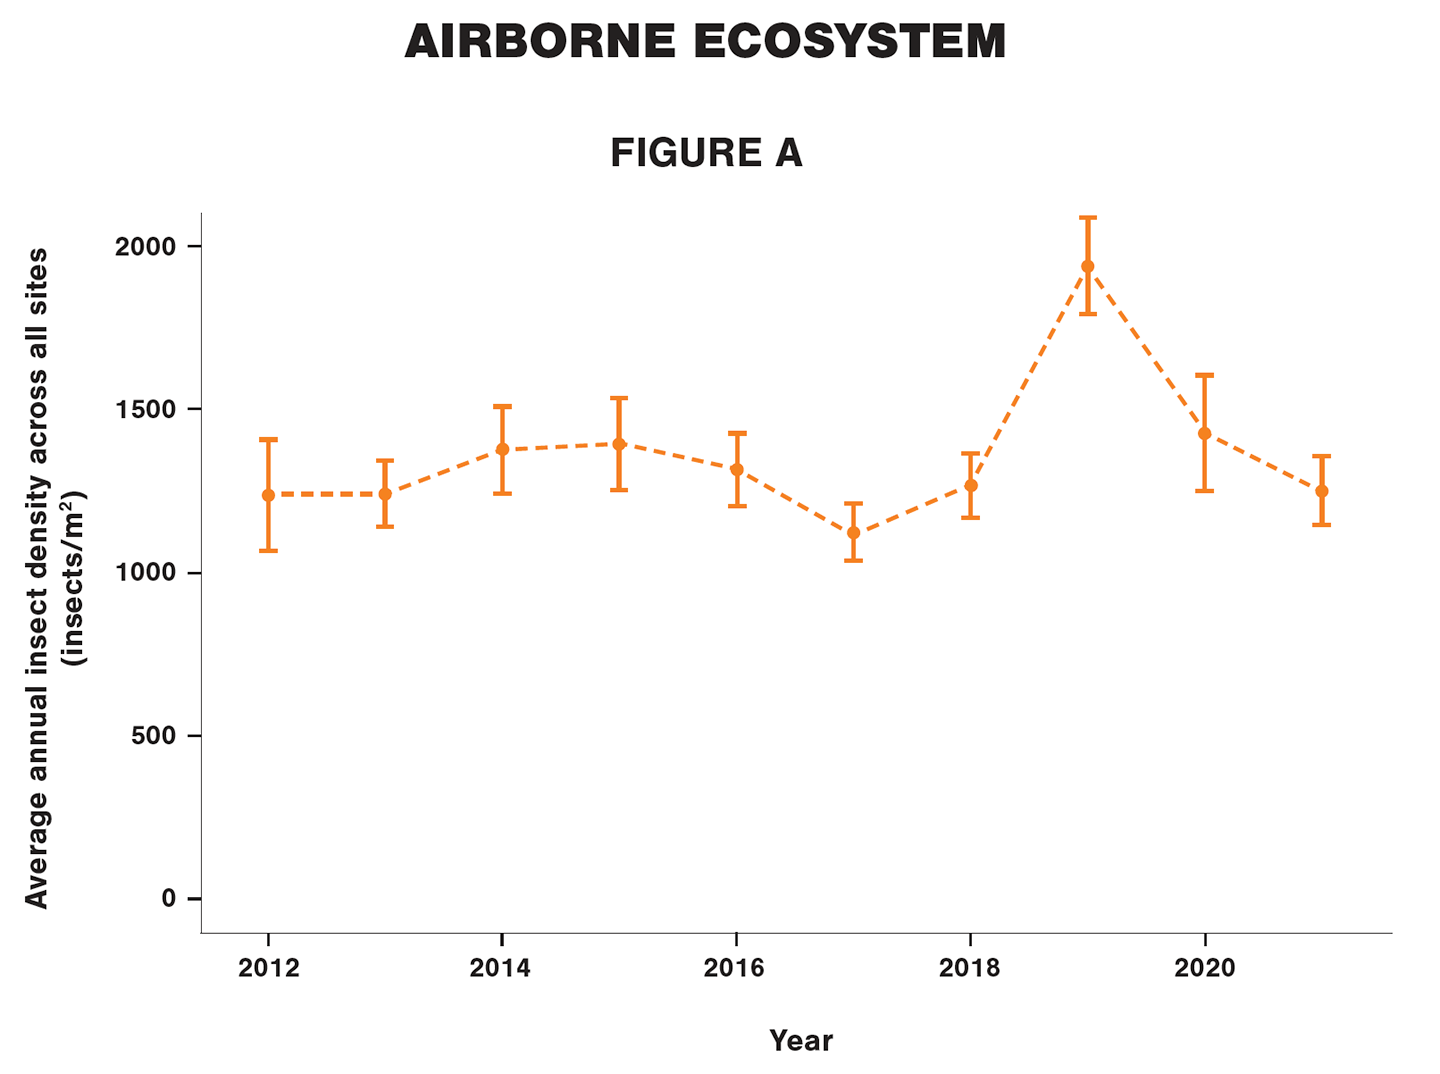
Researchers studied insect abundance using weather radar data. At each of nearly 140 sites, scientists used a radar scan taken at noon every day of the year. They removed the rain, snow and hail from these weather scans. That allowed them to see the density of insects above each site each day. Then they added up all the scans from one site for a whole year. That let them see the annual insect density at every site. They averaged these values across all the sites and plotted that average every year from 2012 to 2021 (Figure A).
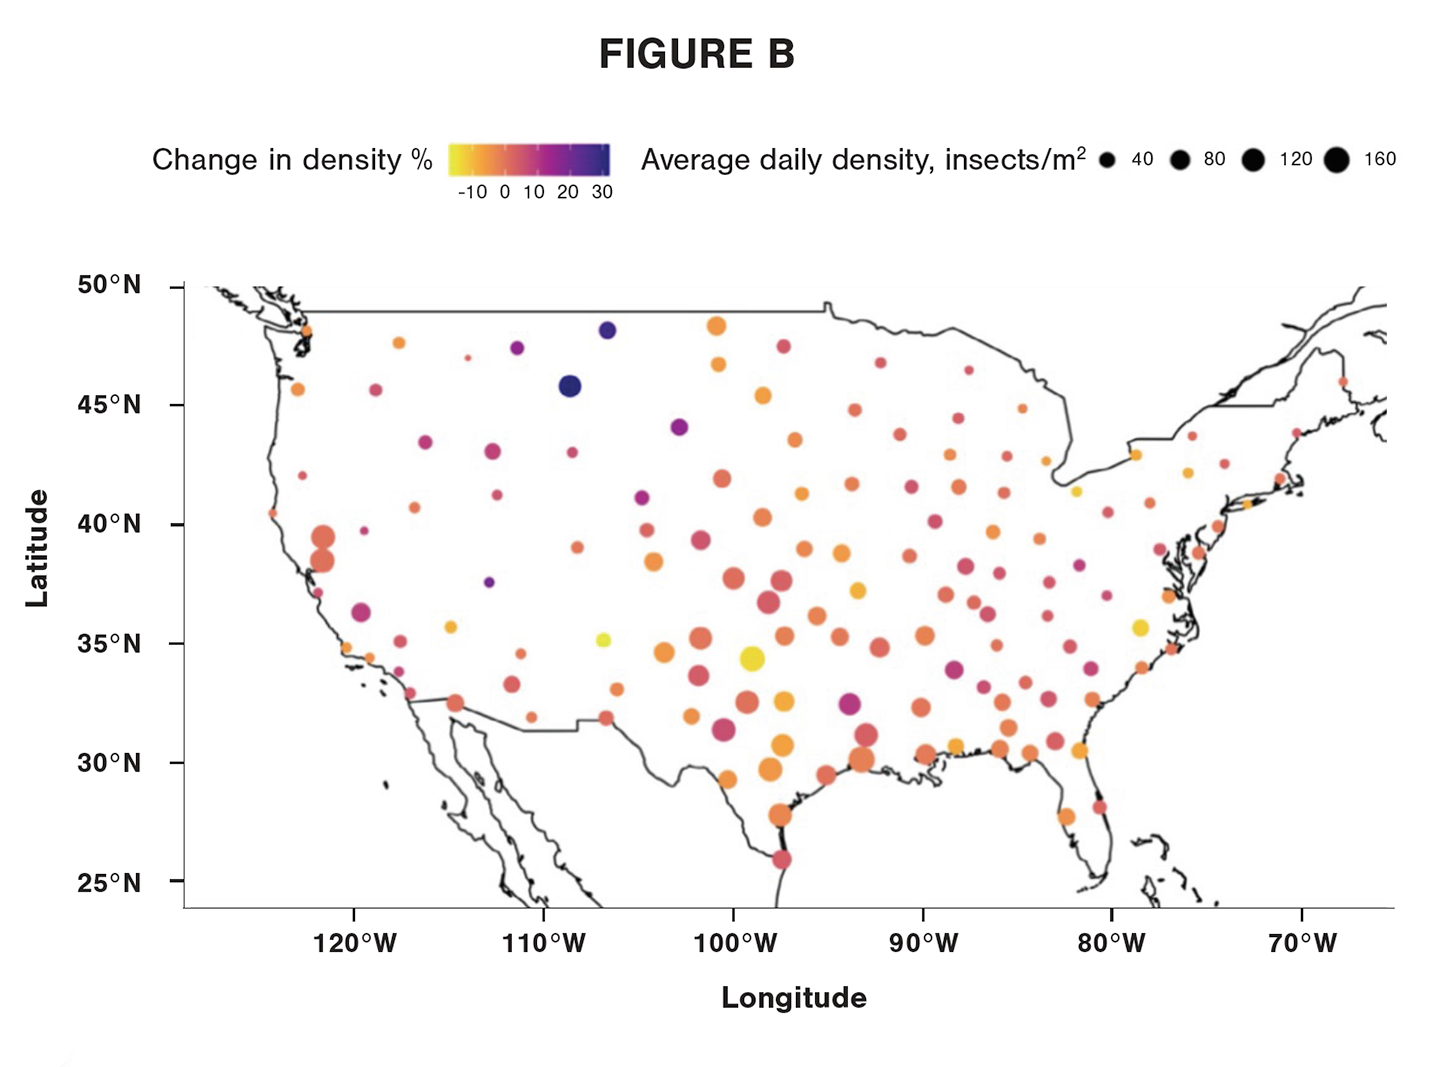
They also studied the average density of insects at each site over the 10-year period (size of dots in Figure B) and the change in density during that time (color of dot).
Data Dive:
- What’s the average daily insect density for 2012? How does that compare with the value for 2021?
- What are possible reasons why some years have higher insect density?
- Look at Figure B. How does the insect density at sites in the northern United States compare with that of the southern United States?
- What are some places where insect density increased from 2012 to 2021?
- What are some places where insect density decreased?
- How might scientists study factors that impacted insect populations?


