How green is your online life?
Some digital choices can leave a big environmental footprint that affects our climate

Reading an email? Watching a YouTube video? Scrolling mindlessly through TikToks? Which apps we use on our phones — and for how long — can make a big difference in the carbon footprint of our digital lives.
ruizluquepaz/E+/Getty Images Plus
This is another in our series of stories identifying new technologies and actions that can slow climate change, reduce its impacts or help communities cope with a rapidly changing world.
In today’s world, it can feel like our entire lives take place in front of a screen. Whether we’re texting friends or laughing at TikToks, our digital devices are always close.
Their proximity can help us feel more connected to friends or family. But it also can physically disconnect us from interacting with people face-to-face. Beyond our mental well-being, these devices also can impact the well-being of our planet.
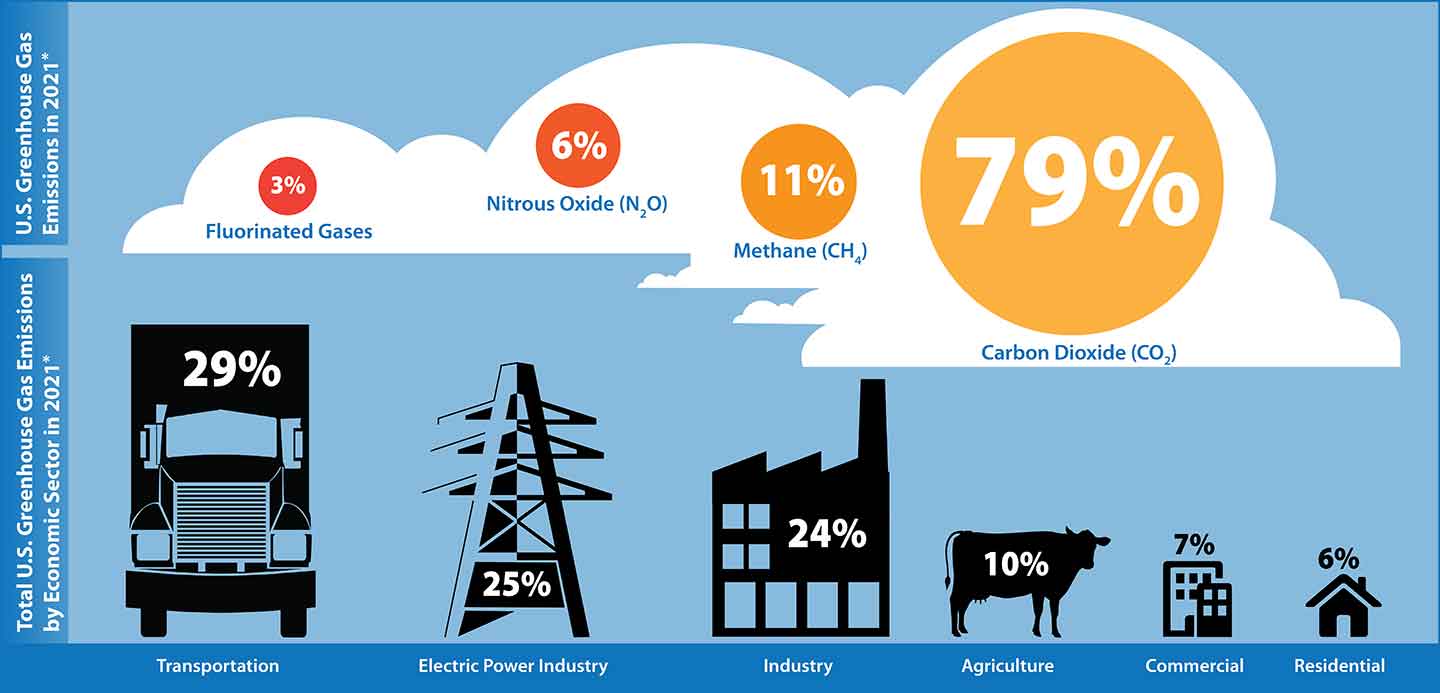
Every device we plug in or charge up uses electricity. Much of that power comes from burning fuels that add greenhouse gases to the air. As a result, each of our devices leaves a trail of climate-warming gases, usually carbon dioxide, or CO2.
We won’t see those gases. They probably won’t even be emitted in our neighborhood. But every text, email, download, scroll or chat will result in a bit more pollution. As millions of other people around the world use their screens every day, too, those little impacts really start to add up.
Not seeing how our online social lives dirty the air or warm the planet won’t make those impacts any smaller. In fact, we’re unlikely to try to limit those impacts if we can’t imagine them — much less tally them.
The answer is not necessarily to give up our devices. Instead, we can learn to use them in more eco-friendly ways, starting with our choice of apps.
CO2-hungry screens
The CO2 emissions from any product or activity depend on how much energy goes into making, using or doing something. For example, flying a plane uses a lot more liquid fuel than driving a car. And riding a bike uses no gas or diesel — just peddling! So cars and planes create more emissions than bikes, because it takes more energy to drill, transport and burn liquid fuels.
The same idea applies to our phones, says Jessica McLean. This geographer studies how people, technology and the environment interact. She’s based at Macquarie University in Sydney, Australia. How we use a device affects how much energy it consumes, she says. Just like different types of transportation produce different amounts of pollution, so do different types of online activities.

Video streaming leads to more CO2 emissions than other forms of screen use, McLean points out. To stream something, your device must access data held at some big computer center. It could be half a world away from you. When we hit play, our devices request lots of those data to fly — faster than lightning — to our devices. The same process happens when we open our email. But video or big image files used in streaming are much larger and more energy-intensive than the simple text of an email.
Just as it’s important that our computers and phones don’t overheat, it’s important that the massive computers at data centers don’t get a fever. So these centers devote a lot of energy to air conditioning the rooms housing their servers and other hardware. Spending all that energy has an environmental cost.
The average number of emails people send each year — roughly 10,000 — can lead to roughly 3 kilograms (6.6 pounds) of emitted CO2. If everyone on Earth sent this many emails per year, that could generate 21.2 million metric tons of CO2. The real climate cost of email is likely smaller because many people don’t have access to email, or are too young to send any.
How much more polluting is video streaming? The answer often changes. But emissions from streaming video are estimated to be around 272 million metric tons. That’s roughly 13 times higher than all those emails.
Similarly, software company Greenspector found in 2023 that scrolling on TikTok for one minute produced emissions equal to 0.96 gram of CO2. In one hour, that’s CO2 pollution equal to about the mass of a plum. If millions of people around the world spend multiple hours per day scrolling on TikTok, that adds up to a lot of emissions. This pollution comes from the energy it takes not only to power a phone but also to send those video data to it.
Clearly, McLean says, “Sending an email or doing text-based work is less carbon-intensive.” (Scientists often use the term “carbon” to refer to carbon-based greenhouse gases, such as CO2.)
The size of the screens we use also can affect their emissions, McLean notes. For instance, a TV that has a large screen and is “smart” — linked to the internet — leads to more emissions than a smaller or less-smart device. This is because the larger device uses more resources to light up pixels and access data.

Big screen-time increase
Since the COVID-19 pandemic, screens have played an ever-bigger role in most of our lives. That means the amount of energy they’re consuming — and pollution they’re generating — has risen as well.
Screen time is something that Qustodio tracks. Throughout last year, this digital parental-safety company tallied data for 400,000 children in the United States and Europe. Use of messaging apps that emit fairly little carbon dropped in 2022. Meanwhile, use of the social-media apps linked to higher emissions climbed.
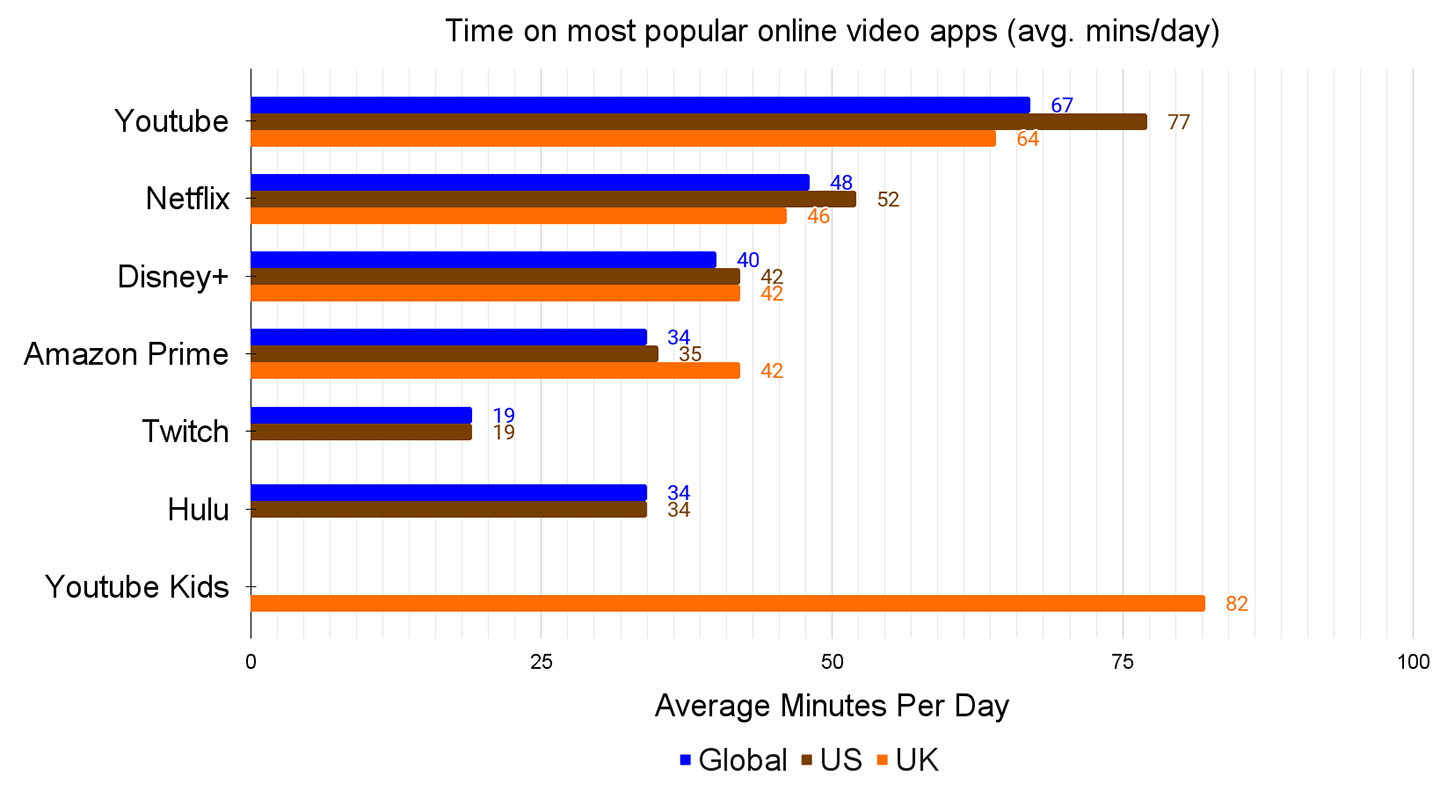
On average, kids streamed video on apps such as YouTube for 45 minutes per day in 2022. That was up 18 percent from the year before. Use of social media apps such as TikTok and Snapchat increased by 12 percent.
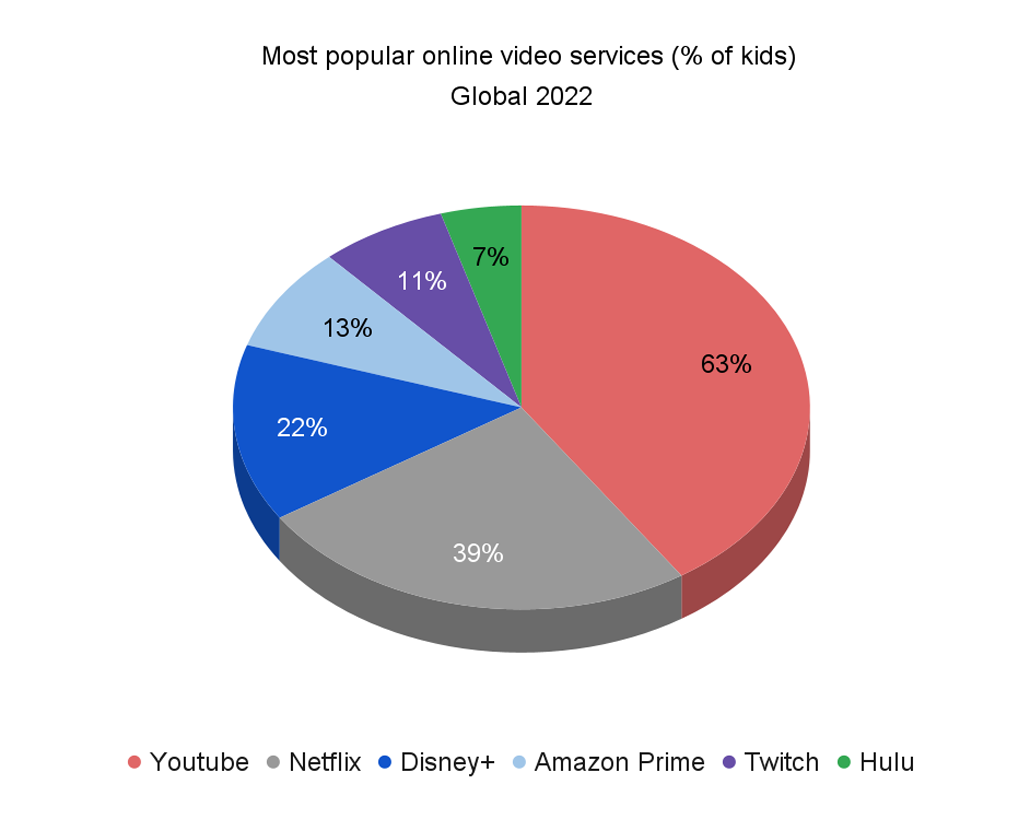
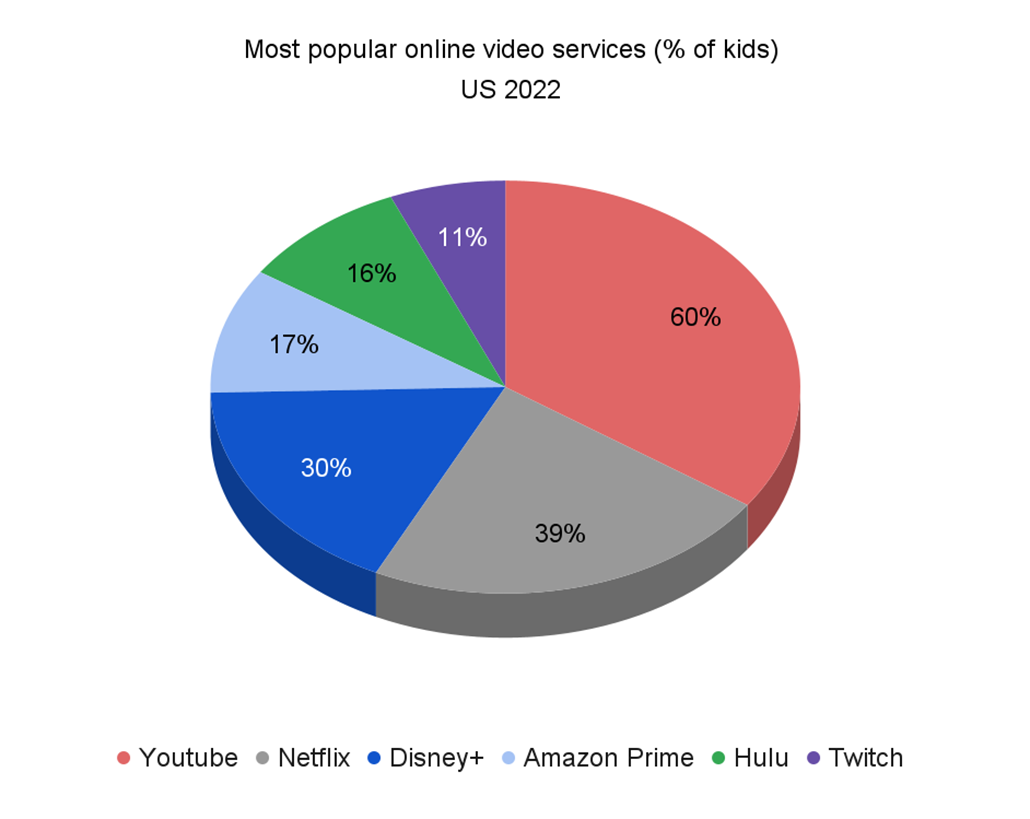
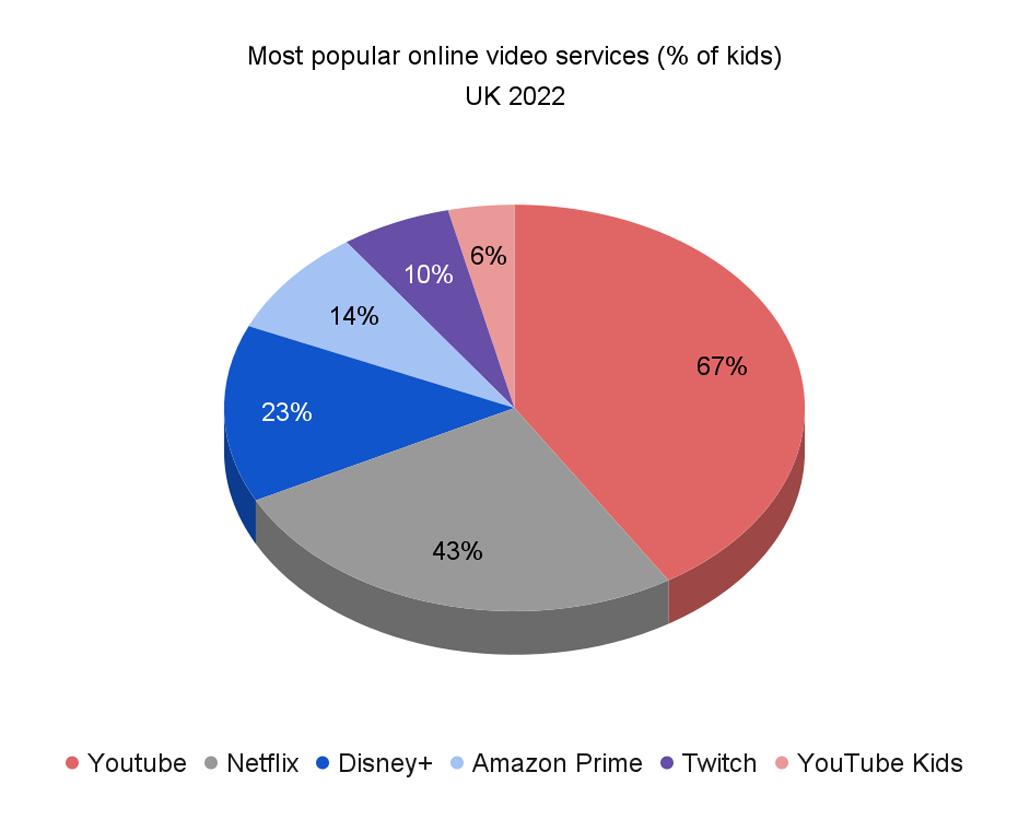
Video streaming around the world
When it comes to streaming video, YouTube reigns king among kids, data from Qustodio’s survey show.
These findings echo ones from Monique Hedderson. She’s a scientist at Kaiser Permanente in Oakland, Calif. Her team collected data on screen time during the pandemic. It followed 228 children between the ages of 4 and 12.
Over the two years ending in August 2021, “We saw increases in all types of screen use,” Hedderson says. This included watching TV, playing games, video chatting and browsing websites.
Social-media use by kids under many apps’ minimum age of 13 also increased over this time.
Clearly, screen time by kids 15 and under has increased in recent years. That has been especially true for streaming services and video on social media. And both of those have a relatively high “carbon footprint.” This is the estimated amount of CO2 (or similarly climate-warming gas) created by actions we take in our daily lives, from driving to school to scrolling social media.
From factory to landfill
How we use our devices and how much aren’t the only important issues. How they’re made can have an even greater environmental impact.
“Glass, minerals, metals are all required for the digital technologies that we use,” says McLean at Macquarie University. “These things have to be mined or recycled.” Some are metals. Others are electrically conductive non-metals, such as silicon. And then there are the rare-earth elements used in many batteries and to color our smartphone screens.
Today’s smartphones and computers rely on lots of tiny computer chips. Those chips are made using materials dug up from the Earth and refined in labs across the world. Chips are then combined with metals and glass to make our devices’ screens, cases and wires. Plenty of energy goes into extracting the raw ingredients, building the devices and then shipping them to us. For example, lithium is an essential element used in batteries. But for every metric ton of lithium mined, 15 metric tons of CO2 are emitted.
It’s also common practice to replace electronic devices shortly after a new model debuts. Those discards usually get thrown away long before the end of their useful lives. Creating their replacements generates more carbon emissions.
As we invest in replacement phones, tablets and more, the old devices end up in landfills. Because this “e-waste” doesn’t break down naturally, it will sit in a landfill — potentially for millions of years. To put that in perspective, one million years ago the Earth was going through a global ice age called the Pleistocene.
One study tallied the CO2 spewed during the making of consumer electronic devices that are now being thrown away. An estimated 580 metric tons of the gas, for instance, had been emitted in making devices discarded in 2020 alone. That’s a mass equal to 85 African elephants. Those findings appeared December 2022 in Circular Economy.
How can we limit that?
Luckily, there are small steps we all can take to lower the climate impacts of our digital lives.
Mike Hazas works at Uppsala University in Sweden. There, he studies environmental impacts of our streaming, social networking and gaming. He says that one way to make greener use of our devices is to keep them as long as possible.
We shouldn’t trade in a device for a newer version so frequently, Hazas says. Not even for a more efficient, greener model. “It’s much more effective to prolong the life of the hardware that you use,” he says. “That is by far going to have much more impact.” For instance, he recommends replacing a phone no sooner than “every four to five years.”
Another tip: Turn off features like auto-play when streaming video. Auto-play algorithms can keep us scrolling longer than we intend to. They also can play videos — using energy — after we’ve fallen asleep. Hand-picking what to watch next can be a more sustainable and mindful approach.
Hedderson also recommends that schools teach kids the climate impacts of their screens, starting at a young age. This should be discussed at the same time kids first learn about digital safety, she says. It can even be discussed along with other climate topics, such as the carbon footprint of dining on meats versus plant-based foods.
“A good starting place for communication is family dinner,” she says. Families could then decide “where screens fit into [their] priorities.” The American Academy of Pediatrics offers online tools to jumpstart such conversations.
To inform those discussions, people can track their emissions using calculators from trusted sources. The Environmental Protection Agency and The Nature Conservancy offer examples.
There’s no one solution to greening our digital lives. Every screen we use, every text we send, every video we scroll through — each has a price. By themselves, each is fairly small. But every small change we make to lower the carbon footprint of our screen use is a step toward slowing the rate of climate change.