Experiment: How does the tilt of Earth’s axis affect the seasons?
Investigate how outdoor temperatures depend on Earth’s tilt, not its distance from the sun

Many people are surprised to learn seasons have nothing to do with Earth’s distance from the sun. The real reason for the seasons is the tilt of Earth’s axis.
Alisher Isagaliev/iStock/Getty Images Plus
The Earth rotates around its axis once every 24 hours. It also revolves around the sun once every 365.25 days. The axis of Earth’s rotation is tilted 23.5 degrees from the plane formed by its orbit around the sun. Figure 1 shows the axial tilt of Earth with respect to its orbit.
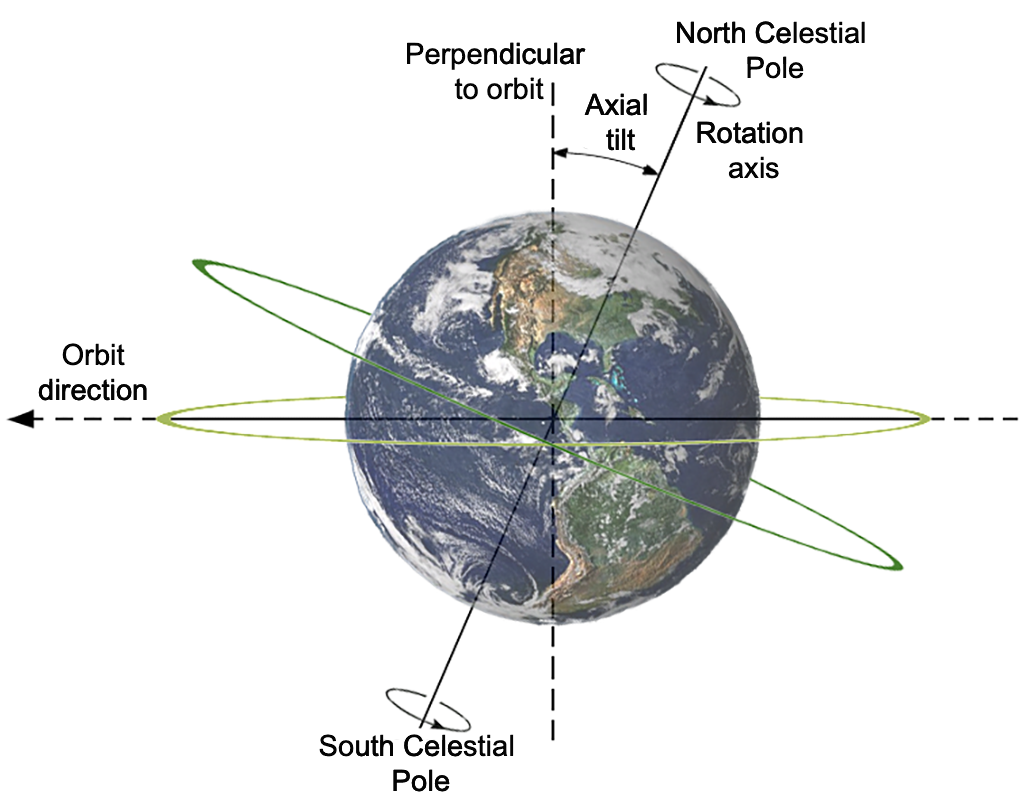
One of the significant consequences of the axial tilt is the creation of a variety of seasons. Look at Figure 1. Imagine that the sun is to the left of Earth. Because of the axial tilt, the sun is directly over a region in the southern hemisphere. As Earth rotates on its axis, the sun stays directly over the southern hemisphere. This is the alignment for winter in North America and summer in Australia.
Let’s skip ahead six months. Imagine Earth has gone halfway around in its orbit. The sun is on the right side of Earth in Figure 1. You can imagine that the sun is now directly above a region in the northern hemisphere, meaning it is summer in North America and winter in Australia.
The hemisphere that is tilted toward the sun experiences more hours of sunlight each day, which contributes to the warmth of the summer season. The other factor, as discussed above, is that the sunlight at midday strikes the ground at an angle nearer the vertical and thus delivers more energy per unit surface area.
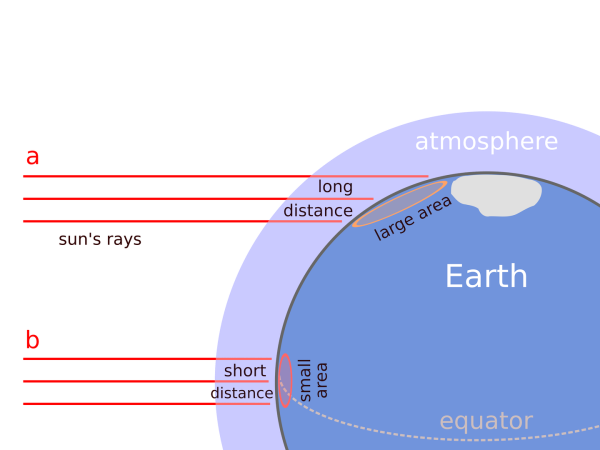
In Figure 2, the amount of sunlight is equal for both “a” and “b,” represented by the red lines. But the area on the surface of Earth that is struck by “a” is larger than the area struck by “b.” Even though the two columns of lines have equal amounts of solar energy, the energy per unit area is smaller at the pole than it is at the equator.
In this project, you will measure the temperature on a globe heated by a heat lamp (the “sun”) and investigate how it varies with latitude and the relative position of the globe and the lamp.
Terms and concepts
- Rotate
- Axis
- Revolve
- Plane
- Orbit
- Axial tilt
- Solar energy
- Energy per unit area
- Latitude
- Tropic of Cancer
- Tropic of Capricorn
- Longitude
- Longitudinal line
Questions
- How did the Earth come to have an axial tilt? (Hint: It’s related to why we have a moon.)
- Where are the Tropic of Cancer and the Tropic of Capricorn on your globe? What is special about these lines?
- Where are the lines of latitude and longitude?
- How does the axial tilt vary over thousands of years?
- What keeps the axial tilt relatively stable?
Resources
- Wikipedia Contributors. (2009, February 10). Axial tilt. Wikipedia: The Free Encyclopedia. Retrieved March 4, 2009.
- Wikipedia Contributors. (2009, February 26). Season. Wikipedia: The Free Encyclopedia. Retrieved March 4, 2009.
Materials and equipment
- A globe of Earth
- A heat lamp with a stand. The stand can be purchased at any hardware store. Heat lamps are available at some hardware stores, or online from sites like Amazon.com. You can also just use sunlight.
- An infrared thermometer. Most versions should work, including the ones sold in drug stores. If you want a version that uses a laser to pinpoint the region that is being scanned, you can buy them online from websites like Amazon.com.
- Protractor
- Ruler
- Lab notebook
Experimental procedure
Setting up and recording your data
- Place the heat lamp on a hard, flat surface that will not be disturbed.
- Use the floor or a large table surface.
- Alternatively, you can use sunlight to warm the globe.
- Adjust the heat lamp so that it is pointing horizontally.
- The lamp will stay horizontal (parallel to the floor) throughout the experiment.
- Make sure that the globe surface and any surrounding items are not being overheated by the lamp.
- Place the globe near the heat lamp.
- Adjust the distance so that the globe is evenly and gently warmed by the heat lamp.
- Be careful not to overheat the globe.
- Now you will position the Earth as it is in summer in the southern hemisphere. (Looking at Figure 1, the lamp should be to the left of the globe.) In the following steps, the lamp and the globe should be positioned so that the light from the sun (lamp) strikes the southern hemisphere from directly overhead.
- Position the lamp and the globe so that the light from the lamp strikes the globe directly above (perpendicular to) the Tropic of Capricorn.
- Since dark colors will absorb more light from the lamp, spin the globe so that the region of the South Pacific Ocean is near the lamp.
- Wait five minutes or so to allow the temperature of the globe to stabilize.
- You can take temperatures while you are waiting to see how quickly the globe warms up and when the temperature is stable.
- You will use the infrared thermometer to read the surface temperature of the globe at the following points. The approximate angle of the “sun” is shown in parentheses, and you will use these angles in your graphs.
- South Pole (23 degrees)
- Tropic of Capricorn (90 degrees)
- Equator (66 degrees)
- Tropic of Cancer (44 degrees)
- North Pole (0 degrees)
- The North Pole is dark 24 hours a day during summer in the southern hemisphere. Use 0 degrees for points that receive no light. All of the areas receiving no light should be the same temperature.
- Hold the thermometer close to the globe, about 2 centimeters (0.8 inch) away. Experiment to find the best distance.
- Take note of the angle and distance (relative to the globe) at which you hold the thermometer. Note it in a data table in your lab notebook. Keep the angle and distance consistent in all of your readings. The points at which you take the readings should be along a longitudinal line (that is, along a north-south line).
- Take at least three readings from each latitude.
- Average your readings and record the results in your lab notebook.
Graphing your results
- Subtract the temperature at the North Pole from all of the temperatures.
- This will give you the temperature change due to the heat lamp.
- Graph the temperature change vs. the angle of the sun.
- Put the angle of the sun on the x-axis.
- Name of the location (South Pole, etc.) on the chart.
- Put the temperature change on the y-axis.
- Label the chart Southern hemisphere summer/Northern hemisphere winter.
- Repeat for other seasons, including summer, fall and spring in the northern hemisphere (winter, spring and fall in the southern hemisphere).
Variations
- Repeat the procedure using a uniformly colored sphere (for example, a ball from a toy store) instead of a globe. Draw latitude lines at 15-degree intervals. This will prevent any errors due to color differences on the globe.
- Use a protractor to measure the angle from the lamp to the various points on the globe.
- Repeat the procedure, but include more points at which you measure the temperature, such as the Arctic and Antarctic Circles.
- Calculate the relative energy per unit area for each point. Use the point directly under the sun as “100 percent” and relate the other points to this point. How does the energy per unit area relate to the temperature?
- Look up the actual change in distance between Earth and the sun over the course of a year. Use the heat lamp and globe to model the effects of the different distances on temperature on Earth (change the distance by the same percentage). Compare the size of this effect with the effect due to axial tilt.
- Use a piece of dark-colored cardboard to more precisely measure how the angle of the incident light is related to temperature and energy per unit area. Hold it at various angles (use a protractor) to the lamp, keeping the distance constant.
This activity is brought to you in partnership with Science Buddies. Find the original activity on the Science Buddies website.